USA MomentumParameter sensitivity analysis
One-at-a-time sweeps across the momentum blend, market-cap floor, portfolio size, regime window, fundamental filter and costs, plus calendar-year returns and rolling 3-year performance, behind the USA momentum strategy. 2005–2026, Sharadar data — the only market in the family with survivorship-complete history (11,000+ recorded delistings back to 1998), so these numbers carry no survivors-only caveat. Harness baseline 26.0%/0.94 vs canonical series 25.6%/0.92 — convention noise.
I. Baseline (live config)
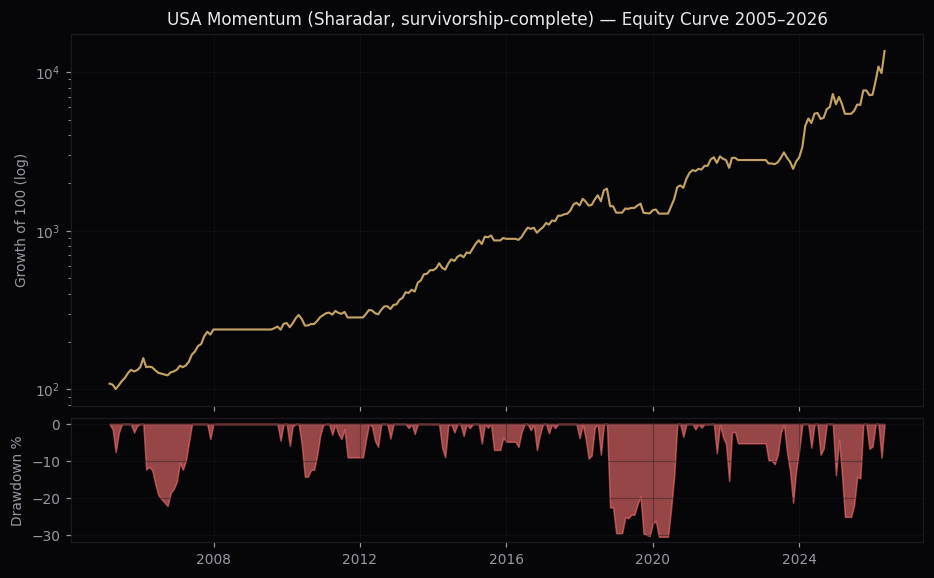
50% × 6M-1 + 50% × 12M-1 momentum blend · mcap > $10B · EBIT(TTM)>0 (point-in-time availability) · top 7 equal weight · S&P 500 vs MA250 · 20bps RT — CAGR +26.01%, Sharpe 0.944, Sortino 1.95, MaxDD -30.3%.
II. Momentum Blend
| Blend | Sharpe | Sortino | CAGR | MaxDD |
|---|---|---|---|---|
| 100% 12-1 | 0.98 | 2.21 | +26.59% | -19.9% |
| 75/25 | 0.962 | 2.01 | +26.47% | -32.7% |
| 50/50 (live) | 0.944 | 1.95 | +26.01% | -30.3% |
| 25/75 | 0.914 | 1.83 | +25.18% | -31.9% |
| 100% 6-1 | 0.739 | 1.4 | +19.76% | -29.7% |
| 50/50 skip-0 both | 1.04 | 2.23 | +27.68% | -33.3% |
Pure 12-1 tests slightly better than the live 50/50 (0.98 vs 0.94, with a notably shallower −19.9% MaxDD), and skip-0 on both legs better still (1.04) — all within plateau distance. Pure 6-1 alone is materially worse. The live blend sits mid-plateau; no change is warranted on in-sample differences of this size.
III. Market Cap Floor
| Floor | Sharpe | Sortino | CAGR | MaxDD |
|---|---|---|---|---|
| $2B | 0.69 | 1.29 | +22.96% | -47.0% |
| $5B | 0.639 | 1.18 | +19.56% | -41.0% |
| $10B (live) | 0.944 | 1.95 | +26.01% | -30.3% |
| $50B | 0.551 | 1.0 | +13.13% | -40.2% |
An unusual result worth knowing: lowering the floor makes it worse ($2B: 0.69, $5B: 0.64 vs $10B: 0.94). Unlike Canada/Germany, the US edge at top-7 concentration lives in liquid mega/large caps — the $10B floor is an alpha choice here, not just a liquidity constraint. Mega-cap-only ($50B) over-restricts (0.55).
IV. Portfolio Size (N)
| N | Sharpe | Sortino | CAGR | MaxDD |
|---|---|---|---|---|
| 5 | 1.025 | 2.26 | +30.06% | -34.4% |
| 7 | 0.944 | 1.95 | +26.01% | -30.3% |
| 10 | 0.916 | 1.84 | +22.44% | -23.9% |
| 15 | 0.869 | 1.7 | +19.62% | -22.6% |
| 20 | 0.752 | 1.4 | +16.5% | -22.9% |
Opposite of Canada/Germany: concentration pays in the US — N=5 gives the best CAGR (+30.1%) and Sharpe (1.03). Diversifying beyond N=10 steadily destroys both. The liquid universe is what makes concentration survivable here.
V. Regime Filter Window
| Window | Sharpe | Sortino | CAGR | MaxDD |
|---|---|---|---|---|
| MA150 | 0.892 | 1.75 | +23.07% | -34.2% |
| MA200 | 0.91 | 1.8 | +23.86% | -25.0% |
| MA250 | 0.944 | 1.95 | +26.01% | -30.3% |
| MA300 | 0.9 | 1.8 | +25.48% | -38.7% |
| no regime | 0.688 | 1.15 | +24.05% | -73.5% |
MA250 is the best of a flat neighborhood (200–300 all fine). The regime's job is the drawdown: without it, CAGR barely changes but MaxDD explodes from −30% to −73.5%.
VI. Fundamental Filter
| Filter | Sharpe | Sortino | CAGR | MaxDD |
|---|---|---|---|---|
| EBIT(TTM)>0 (live) | 0.944 | 1.95 | +26.01% | -30.3% |
| None | 0.755 | 1.4 | +23.97% | -51.5% |
EBIT(TTM)>0 adds +0.19 Sharpe and cuts MaxDD from −51.5% to −30.3% — it mostly protects the tail (keeps unprofitable story-stocks out of a 7-name book).
VII. Transaction Costs
| Cost | Sharpe | Sortino | CAGR | MaxDD |
|---|---|---|---|---|
| 0bps/side (0bps RT) | 0.986 | 2.06 | +27.05% | -29.3% |
| 10bps/side (20bps RT) | 0.944 | 1.95 | +26.01% | -30.3% |
| 25bps/side (50bps RT) | 0.881 | 1.8 | +24.47% | -32.0% |
| 50bps/side (100bps RT) | 0.777 | 1.54 | +21.94% | -34.6% |
Mega/large caps: 20bps RT is conservative if anything; even 100bps RT keeps 0.78.
VIII. Calendar-Year Returns vs S&P 500
| Year | Strategy | S&P 500 | Excess |
|---|---|---|---|
| 2005 | +37.9% | +5.7% | +32.2pp |
| 2006 | -3.7% | +13.6% | -17.3pp |
| 2007 | +79.4% | +3.5% | +75.9pp |
| 2008 | +0.0% | -38.5% | +38.5pp |
| 2009 | +9.8% | +23.5% | -13.7pp |
| 2010 | +12.3% | +12.8% | -0.5pp |
| 2011 | -3.4% | +-0.0% | -3.4pp |
| 2012 | +21.1% | +13.4% | +7.7pp |
| 2013 | +64.1% | +29.6% | +34.5pp |
| 2014 | +27.9% | +11.4% | +16.5pp |
| 2015 | +23.3% | -0.7% | +24.0pp |
| 2016 | +18.4% | +9.5% | +8.9pp |
| 2017 | +37.2% | +19.4% | +17.8pp |
| 2018 | -10.0% | -6.2% | -3.8pp |
| 2019 | +3.7% | +28.9% | -25.2pp |
| 2020 | +71.8% | +16.3% | +55.5pp |
| 2021 | +20.4% | +26.9% | -6.5pp |
| 2022 | +0.2% | -19.4% | +19.6pp |
| 2023 | +4.0% | +24.2% | -20.2pp |
| 2024 | +116.2% | +23.3% | +92.9pp |
| 2025 | +14.8% | +16.4% | -1.6pp |
| 2026 | +88.7% | +4.1% | +84.6pp |
IX. Rolling 3-Year Performance
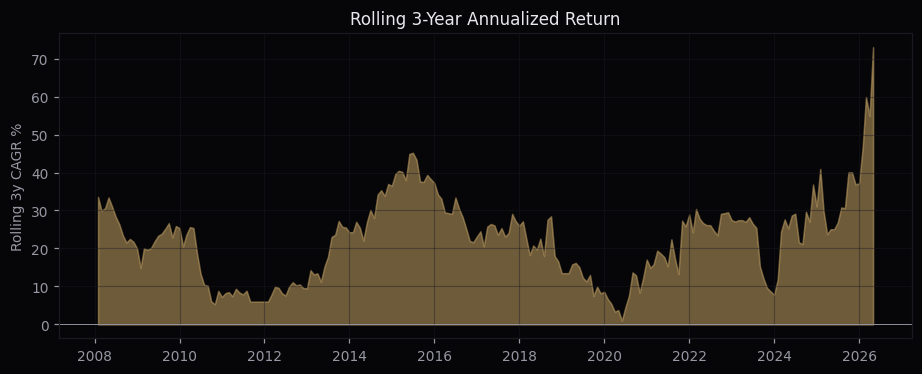
Mean rolling 3-year CAGR +22.4%, range +1.0% to +73.0%, negative in 0.0% of all 3-year windows.
X. Limitations
- All sweeps are in-sample (2005–2026); plateaus, not peaks, are the evidence. The strategy also inherits multi-market selection bias.
- Top-7 concentration means high idiosyncratic risk: single-name events move the book ~14% each.
- S&P 500 benchmark is price-return in the yearly table (understates the bench by ~2pp/yr of dividends).
- Data is survivorship-complete (Sharadar) — the one caveat the other markets carry that this one does not.