Taiwan MomentumTWSE strategy report
A momentum strategy on the Taiwan Stock Exchange, built with the same lookahead-free engine and data-quality discipline as our Canada and UK strategies. Research stage — not yet a live signal.
I. Headline Result
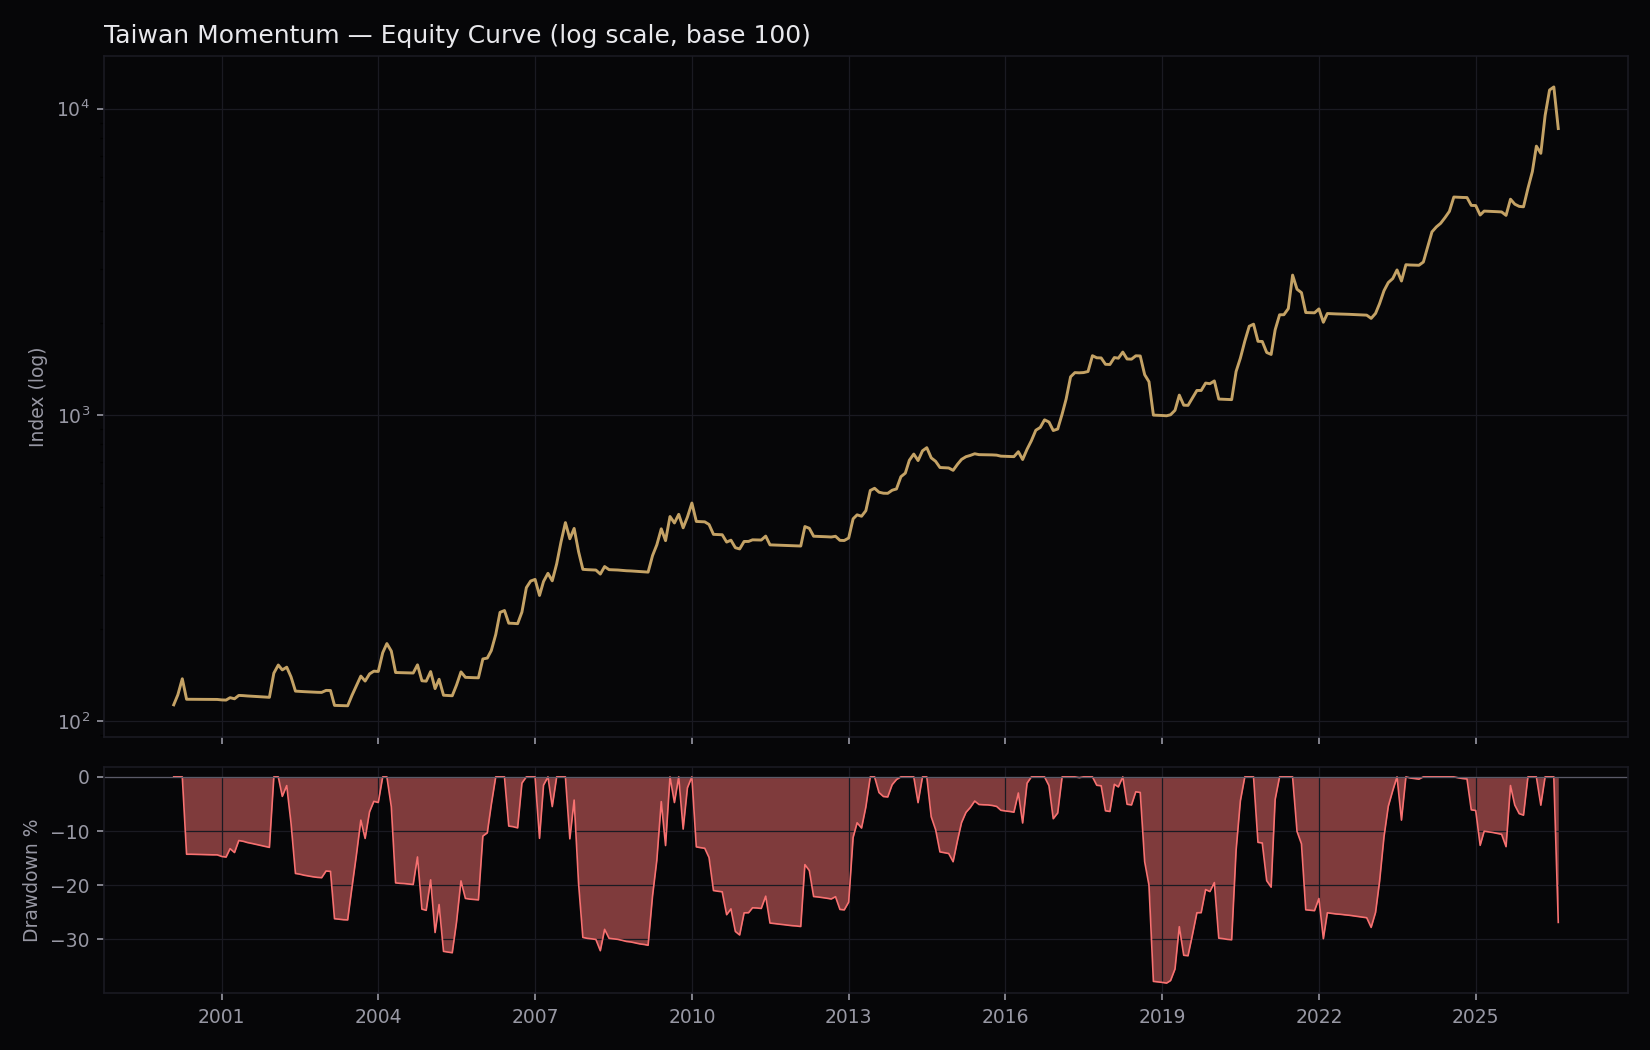
II. Data Quality: A Different Bug Than Canada or UK
Neither the 999999.9999 sentinel bug (Canada, UK) nor scattered per-company bad ticks were the dominant issue here. A full scan of the raw 2000–2026 universe found 989 extreme (>+300%/<−85%) monthly ticker-returns across 211 tickers — concentrated on a small number of specific calendar dates where up to 121 unrelated tickers spiked on the exact same day and reverted the next trading day (e.g. 2000–05–06, 05–20, 06–03, 06–17). That pattern — many unconnected companies, one bad day, clean reversal — points to a data-pipeline snapshot error on those specific dates, not a per-company corporate-action or reporting issue.
A single-day despike (detect a >4x price jump that reverts to <0.3x the next trading day, or the mirror crash-and-recover case) cut the extreme-event count from 989 to 98 — a 91% reduction — using the exact same bounded-ffill mechanism already in the engine for delisted names. Half of the residual 98 events still sit inside the top-50%-by-mcap universe on average, so this isn't a complete cleanup, but it's the difference between an unusable backtest and a plausible one.
Verified directly against the real backtest engine which corrupted returns actually reached a held position — found one that mattered. Of 3 flagged ticker-months, 2 were the same name (2499): roughly 15% of its entire 26-year price history alternates between two unrelated price levels (≈4.1 and ≈200–250) scattered across the whole period, not a single bad day the despike could catch — this looks like two different instruments merged under one data file, not a corporate action. Its fake +5142.7% single-month return (capped to +300% by the engine's existing sanity cap before this fix) still single-handedly drove nearly all of one month's published +19.7% return at 6.7% portfolio weight. Ticker excluded entirely; headline numbers above already reflect this (CAGR 18.74%→18.25%, Sharpe 0.601→0.589 — a modest correction, since the existing cap had already bounded the worst of the damage, but the exclusion is the right fix, not the cap alone). The one remaining flagged event (ticker 5531, −99.2% in Jan 2005) is a genuine gradual multi-month collapse (331→3.29 over ~4 months, smooth decline) — kept as a real momentum-strategy risk, not a data bug.
III. Phase 1 — Momentum Lookback × Market Cap
No regime filter, no fundamental filter, top 15, swept jointly.
| Config | Sharpe | Sortino | CAGR | MaxDD |
|---|---|---|---|---|
| 9M skip 1, mcap top90% | 0.31 | 0.51 | +13.7% | −69.8% |
| 12M skip 0, mcap top90% | 0.29 | 0.48 | +13.7% | −68.9% |
| 9M skip 1, mcap top80% | 0.29 | 0.47 | +12.9% | −70.1% |
| 9M skip 0, mcap top50% | 0.25 | 0.39 | +11.8% | −77.3% |
| 6M skip 1, mcap top90% | 0.22 | 0.35 | +10.7% | −82.0% |
Sharpe is uniformly weak (0.2–0.3) and MaxDD brutal (−69% to −82%) at this stage — expected and by design: Phase 1 is deliberately unprotected, matching the same pattern seen in the Canada/UK research (before their own regime filters were added). The full 35-combination grid is in the underlying data file; 9M/skip-1 at a loose mcap floor is the consistent winner across the top of the table.
IV. Phase 2 — Regime Filter Window
9M/skip-1, mcap top90% fixed, sweeping the ^TWII moving-average window.
| MA window | Sharpe | Sortino | CAGR | MaxDD |
|---|---|---|---|---|
| MA75 (final config) | 0.60 | 1.08 | +18.4% | −37.8% |
| MA50 | 0.53 | 0.93 | +16.4% | −50.5% |
| MA100 | 0.44 | 0.75 | +14.4% | −42.9% |
| MA200 | 0.24 | 0.39 | +9.4% | −47.7% |
| MA150 | 0.21 | 0.34 | +8.5% | −47.8% |
Regime is doing the heavy lifting here. Adding MA75 alone roughly doubles Sharpe (0.31→0.60) and nearly halves MaxDD (−70%→−38%). MA75 also won on Canada's own regime sweep — the same window dominating in two independently-built, differently-sourced markets is a modest point in favor of it not being a curve-fit artifact of either dataset individually.
V. Phase 3 — Fundamental Filter
9M/skip-1, mcap top90%, MA75 fixed. All four filters used in the Canada study, tested here too:
| Filter | Sharpe | Sortino | CAGR | MaxDD |
|---|---|---|---|---|
| None (final config) | 0.60 | 1.08 | +18.4% | −37.8% |
| GrossProfit(TTM)>0 | 0.55 | 0.99 | +16.1% | −38.1% |
| NetIncome(TTM)>0 | 0.54 | 0.98 | +16.0% | −39.9% |
| ROE>0 | 0.53 | 1.02 | +17.9% | −42.0% |
| EBIT(TTM)>0 | 0.52 | 0.96 | +15.8% | −39.2% |
Every fundamental filter makes this strategy worse, not better — the opposite of Canada. There, NetIncome>0 was the single biggest lever in the whole study (Sharpe 0.82→1.35). Here, adding any profitability screen consistently shaves 0.05–0.08 off Sharpe. A plausible reason: Taiwan's momentum leaders in this universe (semiconductor/electronics supply chain names, see Section VI) are often early-cycle or capex-heavy companies whose accounting profitability lags their real operating momentum — a profitability filter here may be cutting genuine winners, not noise. Not fully diagnosed; a market-specific result, not assumed to generalize.
VI. Current Signal
Last signal date 2026–07–31, regime MOMENTUM. Fifteen names, equal weighted — heavily concentrated in the semiconductor/electronics supply chain, consistent with Section V's hypothesis:
VII. Data Audit (2026-08-26): Weekend Ghosts, Delistings, Signal Lag
Three targeted data checks were run after publication, mirroring the Germany audit battery:
- Weekend-calendar contamination — found, fixed, immaterial. The raw TW panel carries 1,245 weekend "ghost" dates (avg 105 tickers covered vs 554 on weekdays) which alter 9,057 end-of-month signal-price cells (median 1.5%, p95 100%). Root cause connection: the "single-day snapshot spikes" of Section II fall on Saturdays (2000-05-06, 05-20, 06-03, 06-17) — the despike was treating the symptom of this same phenomenon, which is why fixing the root cause barely moves the headline: CAGR 18.25%→18.36%, Sharpe 0.589→0.595. The weekend filter is now in the locked engine and the headline numbers above ARE the clean rerun (CAGR +18.36%, Sharpe 0.595, MaxDD −37.8%); the pre-fix figures were 18.25%/0.589/−38.1%.
- Survivorship — structural, worse than Germany. Of 1,205 price histories, only 103 end before the present, none before 2016. The 2000–2015 sample is survivors-only by construction (same EODHD pattern found on XETRA, where deaths start in 2015). The trustworthy window for Taiwan starts around 2017; pre-2016 results should be presumed inflated by an unquantifiable amount. The 103 recorded deaths are all consistently flagged (
is_delisted103/103), and 69 "invisible" names (price data but no fundamentals, hence never eligible) are 90% delisted. - Signal lag (T/T-1) — clean. Signal at month-end close, execution at the next real ^TWII trading day, regime read at signal date — verified by inspection and stress: +1 extra execution day costs 1.7pp (16.51%/0.534 — Taiwan is more timing-sensitive than Germany), and a 1-month-stale signal decays gradually to 12.35%/0.369, the signature of genuine slow momentum rather than lookahead.
VIII. Limitations
- Transaction costs are borrowed from Canada, not measured for Taiwan. 40bps round-trip is a placeholder; real TWSE spreads (and Taiwan's securities transaction tax, which Canada's model doesn't have an equivalent for) haven't been pulled from a broker yet.
- Despike is a partial fix, not a full clean. 91% reduction in extreme events, not 100% — 98 residual extreme months remain, about half inside the top-50%-mcap universe. Some genuine data corruption likely still sits inside the reported numbers.
- Phase 1–3 sensitivity tables predate the ticker-2499 exclusion. Only the two "final config" rows (Sections IV and V) were re-verified after that fix; the other rows in the momentum/mcap/MA/filter grids were run before it. Given the fix moved the final config by only ~0.5pp CAGR / 0.01 Sharpe, the relative rankings across each sweep are very unlikely to flip, but the exact numbers in those non-final rows haven't been individually re-confirmed.
- Research stage only. No live signal, no production script, no site page — this report exists to document the backtest, not to announce a new tradeable strategy.
- Sector concentration is structural, not incidental. Taiwan's investable large/mid-cap universe is itself semiconductor-and-electronics-heavy; a momentum strategy here will very often look like a leveraged bet on that one supply chain, not a diversified equity book.
- No out-of-sample holdout. Every parameter in the final config (Sections III–V) was chosen looking at the same full 2000–2026 history used to report performance.
- Korea (KOSPI) was tested alongside this market and rejected — even after the same despike and regime/fundamental sweeps, best Sharpe found was 0.10 with MaxDD still near −79%. Not published; treated as a market where either momentum genuinely doesn't work at this size/universe, or data quality issues remain undiagnosed.