Norway Momentum Beta
9-month momentum on Oslo Børs · OSEBX MA100 regime · 15 stocks · monthly rebalance · 2000–2026
Report date: 2026-08-25 · Data: EODHD daily (Oslo Børs), OSEBX via Yahoo Finance · Net of 66bps round-trip costs
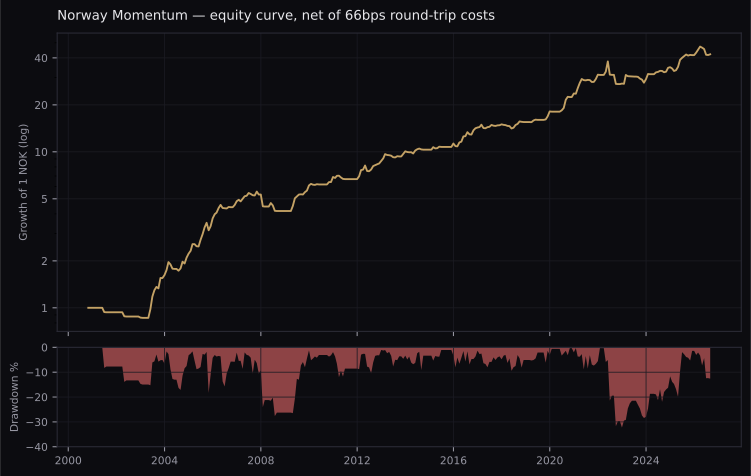
26.5 years (Feb 2000 – Aug 2026). In cash 37% of months. Buy-and-hold within each month (weights drift, no daily rebalancing assumed).
Rules
- Universe: Oslo Børs common shares, Norwegian companies only (ISIN starts with NO — foreign cross-listings excluded), one share class per company (most liquid kept).
- Regime filter: OSEBX below its 100-day moving average → entire portfolio to cash. Checked at each month-end.
- Eligibility: market cap ≥ 565M NOK (~€50M), EBIT (TTM, quarterly, 60-day reporting lag) > 0, price series not stale (see data-quality section).
- Ranking: 9-month total return. Top 15, equal weight.
- Rebalance: monthly, at month-end close. Signal uses only data available at the close; returns accrue from the next session.
- Costs: 66bps round-trip spread applied to actual portfolio turnover (drifted weights vs new targets — entries, exits, and trims all costed).
Annual returns
| Year | Return | Year | Return | Year | Return |
|---|
2000 is a partial year (strategy starts Feb 2000 after the momentum lookback seeds). 2026 through Aug 7.
Why the regime filter matters
Without the OSEBX MA100 overlay the same stock-selection rules earn a similar CAGR (15.2%) but with a -73% maximum drawdown through 2008. The regime filter cuts that to -32% and lifts the Sharpe from 0.79 to 1.04, at the price of sitting in cash 37% of the time.
Parameter sensitivity
All variations below are net of costs, full 2000–2026 history. The chosen configuration is highlighted — note it is a plateau, not an isolated peak.
| Regime MA | CAGR | Sharpe | MaxDD |
|---|---|---|---|
| MA50 | 13.5% | 0.96 | -33.8% |
| MA75 | 13.2% | 0.93 | -34.3% |
| MA100 | 15.1% | 1.04 | -32.2% |
| MA125 | 14.6% | 1.02 | -34.3% |
| MA150 | 14.3% | 0.98 | -34.3% |
| MA200 | 15.6% | 1.04 | -33.8% |
| No regime | 15.2% | 0.79 | -73.4% |
| Portfolio size | CAGR | Sharpe | MaxDD |
|---|---|---|---|
| N10 | 16.5% | 1.03 | -36.4% |
| N15 | 15.1% | 1.04 | -32.2% |
| N20 | 14.9% | 1.09 | -31.8% |
| N25 | 15.2% | 1.13 | -29.2% |
| Momentum lookback | CAGR | Sharpe | MaxDD |
|---|---|---|---|
| 6 months | 13.6% | 0.95 | -32.4% |
| 9 months | 15.1% | 1.04 | -32.2% |
| 12 months | 15.3% | 1.05 | -32.9% |
| Market-cap floor | CAGR | Sharpe | MaxDD |
|---|---|---|---|
| None | 16.6% | 1.03 | -32.3% |
| ~€20M | 15.4% | 1.03 | -32.3% |
| ~€50M (565M NOK) | 15.1% | 1.04 | -32.2% |
| ~€100M | 14.6% | 1.01 | -29.0% |
The €50M floor costs ~1.5pp of CAGR vs no floor but removes names that are not practically tradable (live order books on Oslo Børs micro-caps below ~€50M frequently show spreads above 150bps or no ask at all — verified against live Interactive Brokers quotes in Aug 2026).
Execution timing
The backtest buys at the close of the signal day (month-end). Delaying execution to the next session's close — the realistic worst case for a retail implementation — costs about 1.4pp of CAGR:
| Execution | CAGR | Sharpe | MaxDD |
|---|---|---|---|
| Month-end close (T) | 15.1% | 1.04 | -32.2% |
| Next close (T+1) | ~13.7% | ~0.97 | ~-32% |
Transaction costs
The model charges 66bps round-trip per unit of turnover. Live bid/ask spreads sampled on Oslo Børs in August 2026: large caps (Equinor, Aker, DNO, Atea, Elkem, AF Gruppen) trade at 10–31bps round-trip; mid caps around the typical pick size (Kid ASA, ~€450M) at ~60bps; the smallest names above the €50M floor can reach 80–150bps. With the floor in place, roughly 12–13 of 15 positions sit at or under the modeled cost; the assumption is realistic-to-slightly-optimistic for the smallest tail, and early-2000s spreads were likely wider than today's.
Data quality — what was found and fixed
EODHD's Oslo Børs data contains several serious defects. Each was found, verified against specific tickers, and corrected before the results above were produced:
- Frozen prices: ~22% of Norwegian tickers have runs of 15+ consecutive identical closes (worst case 6.8 years, DLTX). The vendor carries the last traded price forward instead of marking non-trading days. Fix: a ticker frozen ≥15 days is ineligible, and the fake one-day "jump" when a frozen series resumes is excluded from returns (verified on Polaris Media's fake -95% day in Oct 2008).
- Corrupted market caps: share counts wrong by factors up to ~10&sup6; (Oncoinvent showed a market cap 7x Equinor's). 36 Oslo tickers have mcap spikes >20x their own median. A cap-weighted synthetic regime index built on this data was garbage — and an earlier draft of this strategy showed Sharpe 1.23 / MaxDD -19% off the back of it. Fix: the regime index basket is selected and weighted by traded dollar volume (real trading data), validated at 0.92 monthly correlation and 89% MA100-regime agreement against the real OSEBX over 2013–2026; the live signal uses the real OSEBX directly.
- Duplicate listings: Oslo dual share classes (WWI/WWIB, ODF/ODFB, SCHA/SCHB), Euronext Growth duplicate listings ("-ME" suffix) and dead ticker variants — 78 duplicates removed by company-name matching, keeping the most liquid class. An earlier draft held both Wilhelmsen classes simultaneously.
- Foreign cross-listings: ~17% of Oslo tickers are foreign companies; excluded via ISIN country prefix.
- Calendar artifacts: weekend rows and near-empty holiday dates ("phantom trading days") removed; all signals derive from per-ticker month-end resampling, immune to single-ticker stray rows.
- Fundamentals timing: EODHD's filing_date field is unreliable (often equals the period end — lookahead). EBIT uses a flat 60-day reporting lag instead.
Why beta. This strategy is newer than the site's Live strategies and carries two honest caveats:
1. The pre-2013 half of the backtest depends on a synthetic regime index (validated against the real OSEBX only on 2013–2026, where results with real vs synthetic regime are nearly identical: 13.8%/0.96 vs 13.7%/1.02).
2. The underlying EODHD data required heavy cleaning (above). The cleaning is systematic and point-in-time safe, but residual data defects in a 26-year small-market history cannot be fully ruled out.